Change Language :
iglidur® H4 - material data
Material data table
General properties
Unit
iglidur® H4
Testing method
Density
g/cm³
1.79
Colour
brown
Max. moisture absorption at +23°C/50% room humidity
% weight
0.1
DIN 53495
Max. moisture absorption
% weight
0.2
Coefficient of sliding friction, dynamic against steel
μ
0.08-0.25
pv value, max. (dry)
MPa x m/s
0.7
Mechanical properties
Flexural modulus
MPa
7,500
DIN 53457
Flexural strength at 20°C
MPa
120
DIN 53452
Compressive strength at 20°C
MPa
50
Maximum recommended surface pressure (20°C)
MPa
65
Shore D hardness
80
DIN 53505
Physical and thermal properties
Max. long-term application temperature
°C
+200
Max. short-term application temperature
°C
+240
Min. application temperature
°C
-40
Thermal conductivity
W/m x K
0.24
ASTM C 177
Coefficient of thermal expansion (at 23°C)
K-1 x 10⁻⁵
5
DIN 53752
Electrical properties
Specific transitional resistance
Ωcm
>1,013
DIN IEC 93
Surface resistance
Ω
>1,012
DIN 53482
- Without additional load; no gliding movement; relaxation not excluded
Table 01: Material data
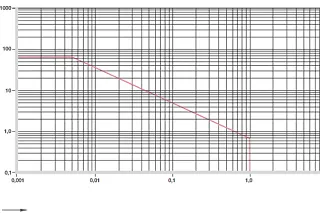
Diagram 01: Permissible pv values for iglidur® H4 plain bearing with a wall thickness of 1mm in dry operation against a steel shaft at +20°C, mounted in a steel housing
X = Surface speed [m/s]
Y = Load [MPa]
iglidur® H4 plain bearings stand for high load capacity, good abrasion resistance and good temperature resistance in addition to economic aspects. Temperatures of up to +200°C, permitted surface pressure of up to 65MPa and excellent chemical resistance are only a few of the essential attributes. Solid lubricants lower the coefficient of friction and support the wear resistance, which was considerably improved compared to the also cost-effective iglidur® H2 plain bearings. iglidur® H4 plain bearings are self-lubricating and suitable for all movements.
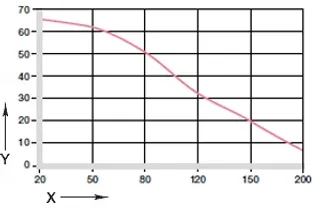
Diagram 02: Maximum recommended surface pressure as a function of temperature (65MPa at +20°C)
X = Temperature [°C]
Y = Load [MPa]
Mechanical specifications
The maximum recommended surface pressure represents a mechanical material parameter. No conclusions regarding the tribological properties can be drawn from it. With increasing temperatures, the compressive strength of iglidur® H4 plain bearings decreases. Diagram 02 shows this inverse relationship. With the long-term permitted application temperature of +200°C, the permitted surface pressure still amounts to 7MPa.
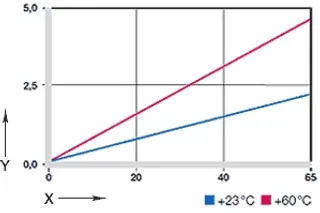
Diagram 03: Deformation under pressure and temperature
X = Load [MPa]
Y = Deformation [%]
Diagram 03 shows the elastic deformation of iglidur® H4 at radial loads.
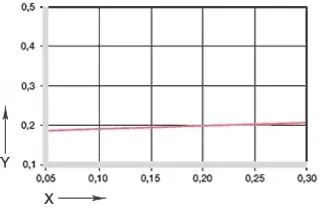
Diagram 04: Coefficient of friction as a function of the surface speed, p = 0.75MPa
X = Surface speed [m/s]
Y = Coefficient of friction μ
Friction and wear
The coefficient of friction of the iglidur® H4 plain bearings is very low (see Diagrams 04 and 05). Please bear in mind that a mating surface with a rough surface finish will increase friction.
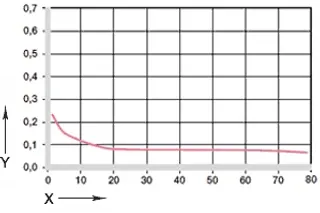
Diagram 05: Coefficient of friction as a function of the pressure, v = 0.01m/s
X = Load [MPa]
Y = Coefficient of friction µ
iglidur® H4
dry
Greases
Oil
Water
Coefficient of friction µ
0.08-0.25
0.09
0.04
0.04
Table 04: Coefficient of friction for iglidur® H4 against steel (Ra = 1μm, 50HRC)
Shaft materials
With many of the suitable shaft materials, iglidur® H4 is the economical alternative to many other high-temperature bearings. The important thing is however the selection of the suitable shaft material. It cannot be generally stated that iglidur® H4 is suitable for use with hard or soft shafts. Tests have however shown that pivoting applications yield better wear data. In rotating applications, the wear increases markedly from 10MPa.


Consulting
I look forward to answering your questions

Shipping and consultation
In person
Monday to Friday: 8 am – 8 pm
Saturday: 8 am – 12 pm
Chat-Service
Monday to Friday: 8 am – 4 pm
WhatsApp-Service
Monday to Friday: 8 am – 4 pm